By IPO Edge Editorial Staff
For most of the last year, the bear case on Apple (AAPL) wrote itself.
Tariffs would gut margins. China was a lost cause. The AI story had no answer. iPhone upgrades had peaked.
Then last Wednesday happened.
Apple posted its best March quarter ever, with revenue of $111.2 billion (up 17%) and diluted EPS of $2.01 (up 22%).
Greater China, the segment everyone wrote off, grew 28%. Services hit another all-time high. The Board authorized another $100 billion buyback and raised the dividend 4%.
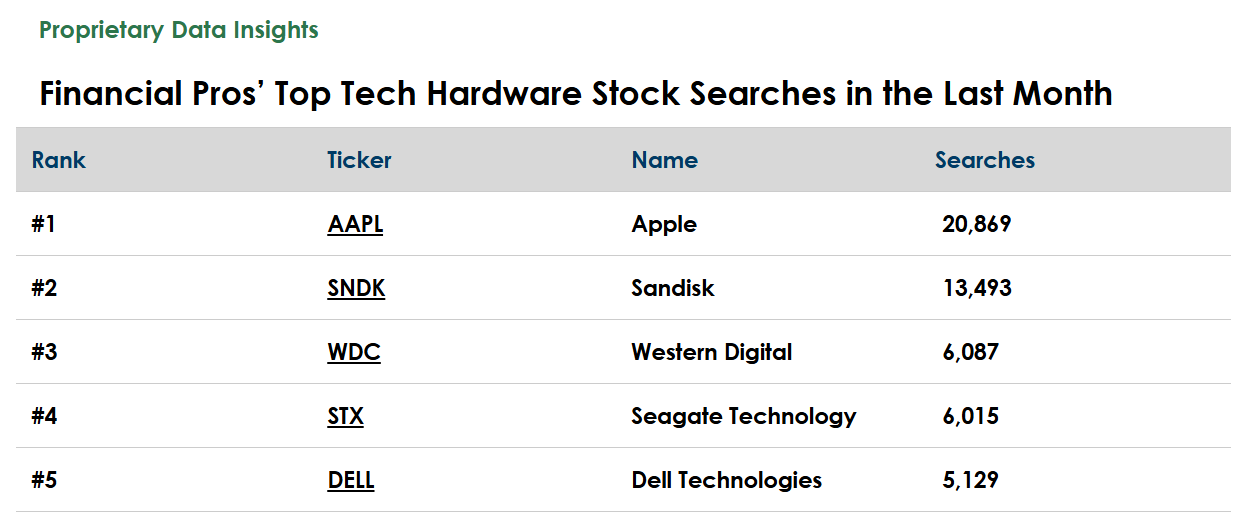
Search volume from financial pros spiked, with Apple drawing nearly 21,000 searches in the past month, per our TrackStar data, more than its next four hardware peers combined.
So is the run sustainable, or did Apple just front-load demand ahead of more tariff drama?
Apple’s Business
Apple needs no introduction, but the company’s transformation does. What was once a hardware story is now a hybrid: $80.2 billion in product sales last quarter alongside $31.0 billion in high-margin services.
The installed base of active devices hit another all-time high across every product category and every geography. Apple sells iPhones, Macs, iPads, wearables, and a growing suite of subscription services to roughly a billion paying users globally.
Apple segments its business into the following areas:
- iPhone (51% of total revenues) – Flagship smartphone line, recently expanded with the iPhone 17 lineup and a new iPhone 17e
- Services (28% of total revenues) – App Store, advertising, iCloud, Apple Music, Apple TV+, and payment services
- Mac (8% of total revenues) – Laptops and desktops, including the newly launched MacBook Neo
- Wearables, Home & Accessories (7% of total revenues) – AirPods, Apple Watch, Vision Pro, and accessories
- iPad (6% of total revenues) – Tablet lineup, recently refreshed with the M4-powered iPad Air
iPhone revenue jumped 22% to $57.0 billion, the standout of the quarter. Services climbed 16% to a record $31.0 billion, propelled by advertising, App Store, and cloud.
Greater China rebounded sharply, with renminbi strength adding fuel. Tim Cook called demand for the iPhone 17 lineup “extraordinary.”
On the strategic front, Apple is going all-in on AI infrastructure. R&D spending jumped 34% year-over-year to $11.4 billion last quarter, citing higher infrastructure costs.
Tariff overhang remains real but manageable. A February Supreme Court ruling struck down certain tariffs, and Apple is applying for refunds.
The company also flagged that semiconductor, NAND, and DRAM supply constraints could pressure costs into the next quarter.
Financials
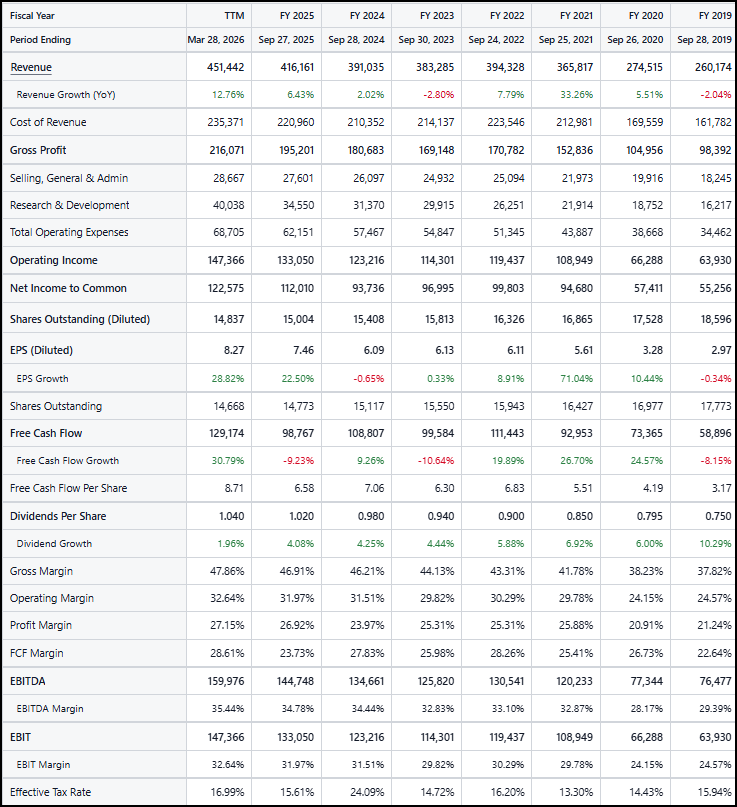
Source: Stock Analysis
Apple’s trailing twelve-month revenue hit $451.4 billion, up 12.8% year-over-year, the strongest growth rate since FY 2021’s post-pandemic surge.
Gross margins continue to climb. TTM gross margin reached 47.9%, up from 46.2% in FY 2024 and 38.2% back in FY 2019, driven by the rising Services mix.
Operating margin now sits at 32.6%, and the company throws off $129.2 billion in free cash flow on a TTM basis.
That FCF easily covers the $7.7 billion in dividends and $37.0 billion in buybacks Apple executed in the first half of FY 2026.
The balance sheet is fortress-grade. Apple holds $146.6 billion in cash and marketable securities against $82.7 billion in term debt. Net cash position is positive and growing.
Valuation
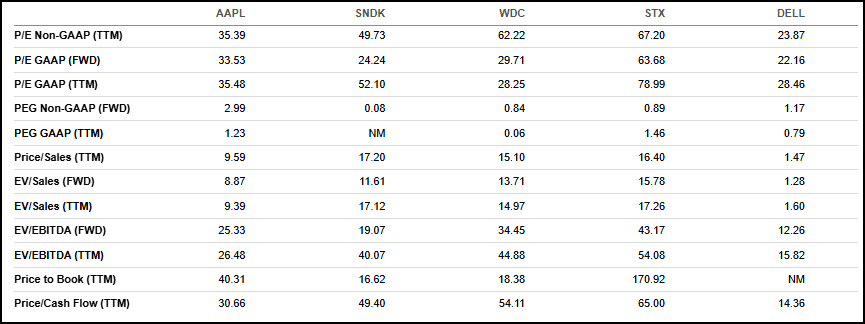
Source: Seeking Alpha
Apple trades at a premium to nearly every peer on this list, with the exception of Seagate Technology (STX).
On forward P/E, Apple sits at 33.5x versus Sandisk (SNDK) at 24.2x, Western Digital (WDC) at 29.7x, and Dell Technologies (DELL) at just 22.2x.
Price-to-cash-flow tells a similar story. Apple commands 30.7x, well above Dell’s 14.4x but cheaper than WDC and STX.
The market is paying up for Apple’s Services mix, capital returns, and brand moat. Whether that’s justified is the central question.
Growth

Source: Seeking Alpha
Here’s where the premium gets harder to defend.
Apple’s 12.8% YoY revenue growth trails SNDK’s 82.8% surge, WDC’s 32.0%, and STX’s 28.9%. Forward revenue growth of 9.6% is the weakest in the group except WDC.
Yet Apple’s three-year revenue CAGR of 5.4% beats WDC and SNDK, both of whom posted negative numbers over that stretch.
The hardware peers are riding an AI-driven storage upcycle. Apple is the steadier compounder.
Profitability

Source: Seeking Alpha
This is Apple’s home turf.
Apple’s 47.9% gross margin trails only SNDK’s 56.0%. EBITDA margin of 35.4% beats every peer except SNDK.
Levered FCF margin of 22.4% leads the group. Return on common equity of 141.5% dwarfs everyone except STX, which benefits from a tiny equity base.
Most striking: Apple generated $140.2 billion in cash from operations on a TTM basis. The next closest, Dell, did $11.2 billion.
Continued…
Our Opinion 7/10
Apple’s quarter was a genuine surprise to the upside, and the company’s cash generation remains in a league of its own.
The dividend hike and fresh $100 billion buyback give investors a tangible return floor.
But the stock isn’t cheap. At 33.5x forward earnings with sub-10% forward revenue growth, you’re paying a quality premium that leaves little room for an iPhone stumble or a tariff escalation.
For long-term holders, Apple stays a core position. For new money, we’d wait for a pullback before adding.
READ MORE
Final Panel Agenda and Closing Registration: 2nd Princeton CorpGov Forum May 21 – Endowments, Activism and Entertainment
Never Miss our Weekly Highlights HERE
Contact:
Editor@IPO-Edge.com
Click HERE to follow us on LinkedIn