
Small caps are back, and IWM is leading the charge
By IPO Edge Editorial Staff
Small caps spent years getting overlooked while mega-cap tech hogged the headlines. The pros are paying attention again.
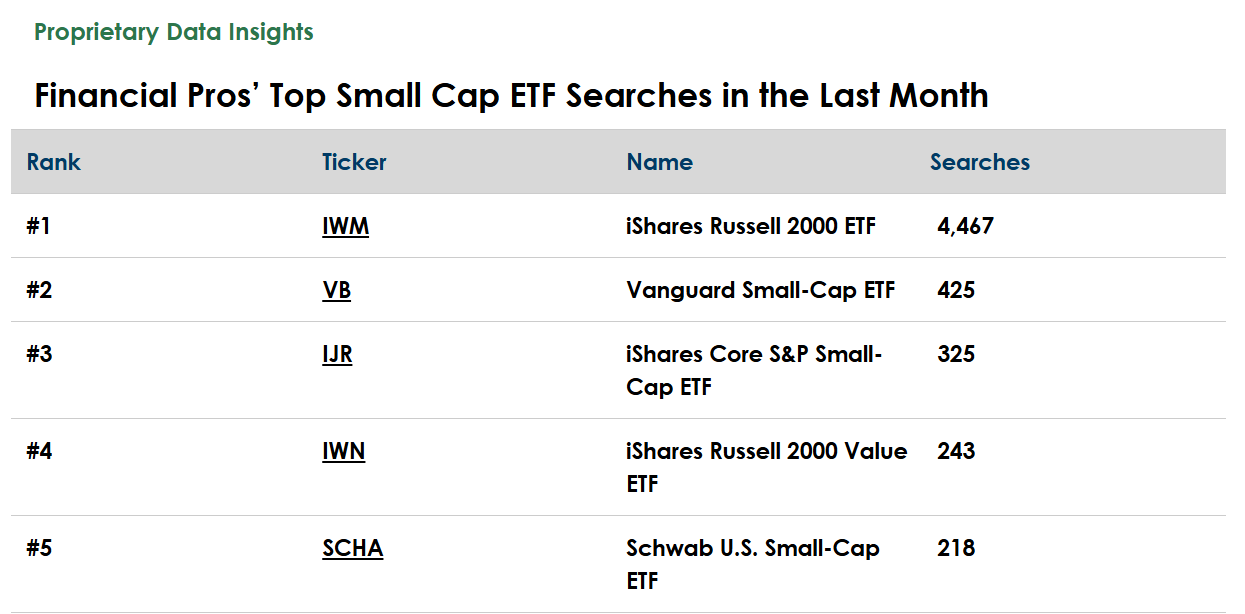
Our TrackStar data shows IWM pulling 4,467 searches from financial professionals last month — more than 10x the next closest fund. That’s not a blip. That’s a rotation signal.
The iShares Russell 2000 ETF (IWM) has long been the default instrument for small-cap exposure, but the renewed interest reflects something bigger than habit. Macro conditions are shifting, valuations are compelling, and the small-cap trade is very much alive.
Never Miss our Weekly Highlights HERE
Here’s what’s driving the attention, and whether the fund deserves a place in your portfolio.
Key Facts About IWM
- Net assets: $74.9 billion
- 12-month trailing yield: 0.97%
- Inception: May 22, 2000
- Expense ratio: 0.19%
- Number of holdings: 1,930
IWM tracks the Russell 2000 Index, a float-adjusted, market-cap-weighted measure of the roughly 2,000 smallest companies in the Russell 3000. It is the broadest and most liquid vehicle for U.S. small-cap exposure in the market.
Unlike indices with quality screens, the Russell 2000 casts a wide net. IWM uses physical replication, investing directly in its index constituents rather than derivatives. What you get is raw, unfiltered small-cap beta.
READ MORE
SpaceX, Anthropic & Beyond: ICR Managing Partner Steve Parish, Live at NYSE
The top holdings tell the story of where small-cap growth is concentrated right now. Bloom Energy (1.76%) brings clean energy infrastructure exposure. Credo Technology (1.07%) is a semiconductor connectivity name with direct AI tailwinds.
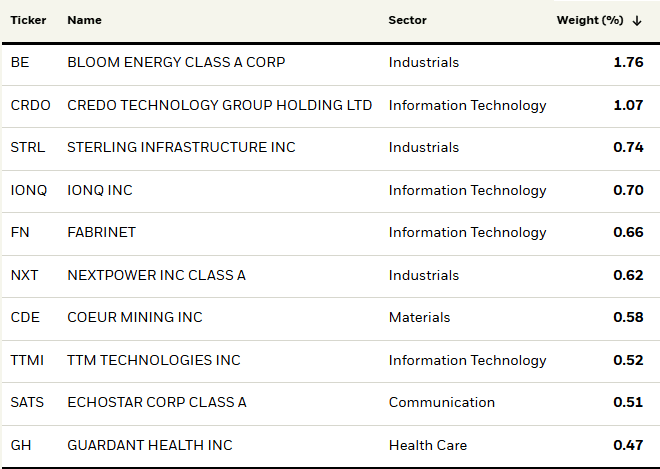
Source: iShares
Sterling Infrastructure (0.74%) plays the domestic reshoring trend, while IonQ (0.70%) gives the fund a quantum computing foothold. Fabrinet (0.66%) rounds things out with precision optical manufacturing tied to AI data center buildout.
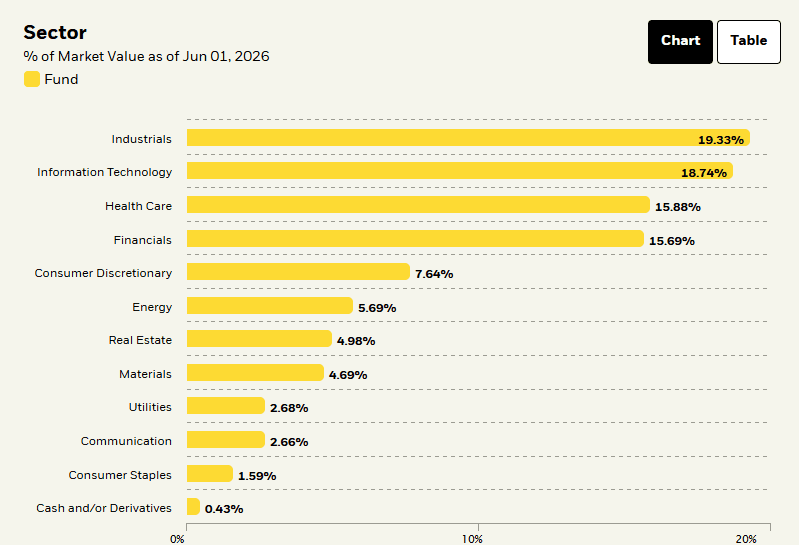
Sectorally, Industrials lead at 19.3%, followed by Information Technology at 18.7%, Health Care at 15.9%, and Financials at 15.7%. That mix captures the domestic economic cycle from multiple directions and limits overexposure to any single theme.
READ MORE
Digital Tools for Big IPOs: Computershare’s Issuer Services North America CEO Ann Bowering, Live at Nasdaq
The domestic tilt is one of IWM’s most important structural characteristics. Russell 2000 companies derive the vast majority of their revenue inside the U.S., making the fund a direct bet on the health of the American economy rather than global trade flows.
Performance
IWM’s recent numbers tell a story of sharp recovery. As of April 30, 2026, the one-year total return stands at 44.2%, tracking almost perfectly with the benchmark’s 44.4%. The three-year annualized return is 18.0%, again in tight lockstep with the index at 18.2%.
The five-year picture is more nuanced. A 5.6% annualized return over that window reflects the years when elevated interest rates and macro uncertainty dragged heavily on small caps. Large-cap benchmarks outran IWM significantly during that stretch.
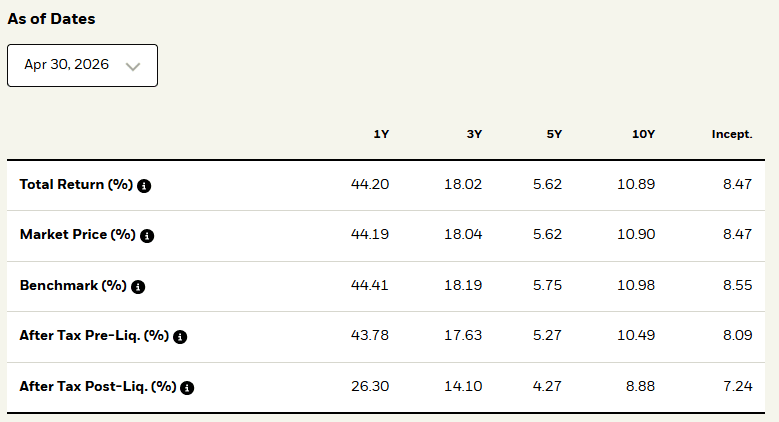
Source: iShares
The 10-year annualized return of 10.9% and since-inception figure of 8.5% paint a more favorable long-term portrait. Investors who stayed patient through the rough patches have been rewarded.
What stands out in the current environment is just how quickly IWM recovered from its 2025 lows. The fund bottomed hard and bounced hard, with the one-year return of 44.2% nearly matching the S&P 500’s own strong run. After years of underperformance, that convergence matters.
READ MORE
The Spill: A 5% Long Bond Yield Has Traders Circling TLT
The benchmark gap — where IWM trails its index by just 0.2% over one year — reflects the fund’s efficient passive construction. For a fund tracking nearly 2,000 stocks, that’s clean execution.
Competition
IWM dominates search volume, but it doesn’t operate in a vacuum. Several other small-cap funds in our TrackStar data take meaningfully different approaches.
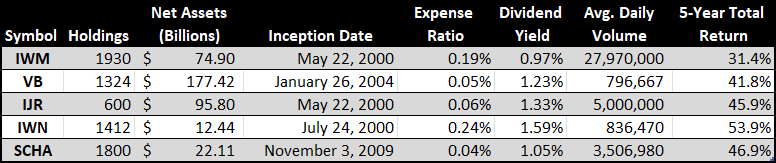
- Vanguard Small-Cap ETF (VB): With $177.4 billion in AUM and a 0.05% expense ratio, VB is the passive giant of the group. Its 1,324 holdings track a different index than IWM and delivered a 41.8% five-year total return with a 1.23% yield. It’s the buy-and-hold default for cost-conscious long-term investors, but with far lower average daily volume than IWM, it isn’t built for active trading.
- iShares Core S&P Small-Cap ETF (IJR): IJR tracks the S&P SmallCap 600, which requires profitability for inclusion — a quality screen IWM lacks. With 600 holdings, a 0.06% expense ratio, and a 45.9% five-year return, it’s arguably the more disciplined small-cap vehicle. The $95.8 billion in AUM and 5 million daily average shares traded make it a serious alternative.
READ MORE
Planet Labs Awarded John Deere Sustainability Award
- iShares Russell 2000 Value ETF (IWN): IWN carves the value subset out of the same Russell 2000 universe with 1,412 holdings. Its 1.59% yield is the highest in the group, and the 53.9% five-year return leads the field. The trade-off is a smaller asset base at $12.4 billion and a tighter value mandate that can lag when growth stocks lead.
- Schwab U.S. Small-Cap ETF (SCHA): SCHA runs the lowest expense ratio in the group at 0.04%, covering 1,800 holdings across the Dow Jones U.S. Small-Cap Total Stock Market Index. Its 46.9% five-year return is solid, and at $22.1 billion in AUM, it’s a credible low-cost option. The 1.05% yield and modest trading volume make it better suited for passive accumulation than tactical positioning.
Our Opinion 7/10
IWM is the small-cap ETF that financial pros reach for first, and the TrackStar data makes that obvious. Its liquidity, options market depth, and sheer breadth make it the most versatile instrument in the space.
The risks are real. IWM includes unprofitable companies that can drag in tougher markets, and its floating-rate debt exposure makes it sensitive to a higher-for-longer rate environment.
But the valuation case for small caps remains compelling, and IWM is the cleanest way to express it. Best suited for investors who want broad, liquid small-cap exposure and can tolerate volatility in exchange for long-term upside.
Contact:
Editor@IPO-Edge.com
Click HERE to follow us on LinkedIn